Monday, March 2, 2015

How to Create a Release Burn-Up Chart

Dec 4, 2016 - This article is moving - please see the article on my personal website listed here, thanks! - https://robfrohman.com/blog-agilewhys/2016/11/28/how-to-create-a-release-burn-up-chart

----------------------------------------------

A release burn-up chart is used to track team progress and to develop data-based forecasts that can be used to help balance trade-offs in achieving a release plan. Charting data should be updated with each iteration. This will keep forecasts current much like an NOAA hurricane landfall chart.

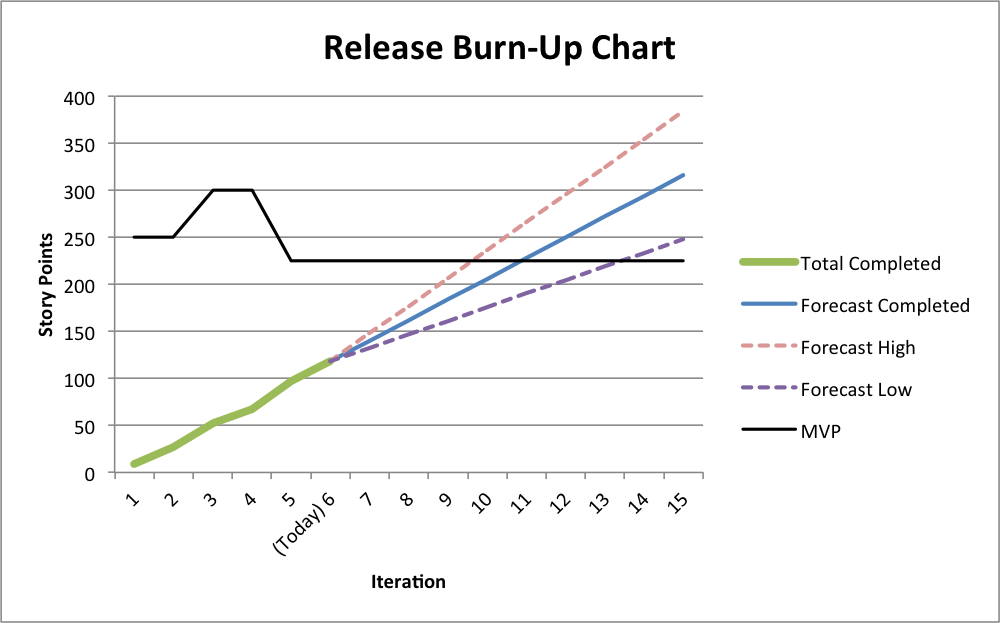
Release burn-up charts are built using summed measures of work over time. In Scrum, this could mean story points per sprint. However it can also be used with other frameworks like Kanban, for example as work items per week. There are tools that will generate these charts but my preference is to use a spreadsheet for more control over the content and delivery. Here we will use Microsoft Excel to develop the release burn-up chart assuming the development team has just completed sprint 6 and would like to forecast out another 9 sprints. Value is measured in story points.

Keep in mind:

  • Make forecasts, not commitments.
  • Prepare to inspect and adapt.
  • Good data will take time to develop so just get started.

The charts and tables can be downloaded as an Excel spreadsheet or as a pdf for reference.


Start with velocity data, something the team is likely tracking already.


Create a spreadsheet using the velocity data and add a column to contain the story point summation. Plot iterations on the horizontal axis and the summed story points on the vertical axis. Extend the iteration count into the future. Here, we are forecasting through sprint 15.


In a separate cell calculate the story point average for the last 3 sprints*. In this case:

15 + 30 + 21 = 66/3 = 22

Add a column to contain the forecast average and carry over the current sum for 'today' as a starting value. Forecast into the future summing the average over time.

Don't fall into the trap of mistaking a forecast for a commitment. It would be easy (and desirable) to state that the team will achieve 228 story points at the close of sprint 11. It is only a likely outcome if nothing changes and the last 3 sprints are an accurate indicator of future performance. Again, think weather...

* Forecasts should be based on recent history, rather than performance overall, simply because things change. 3 sprints are used as a rule of thumb, however use your judgement to assess how much history is relevant to the current work and team. When doing so, consider the contributing factors to change:
  • Team's focus, both what and how the product is being built
  • Team's capability to learn
  • Team membership


In a separate cell, calculate the standard deviation for the last 3 sprints. We will use this value to establish reasonable* upper and lower bounds for the forecast. Here,

σ = 7.55

Create columns for forecast highs and lows where the value is equal to the forecast value + or - the standard deviation. The deviation is additive as the forecast extends into the future. Plotting the high and low values in addition to the average forecast should demonstrate a cone of probability.

An alternative and perhaps simpler, non-statistical approach, is to use the average of the 3 highest sprints and 3 lowest sprints to establish the variance around the average. We are after accuracy, not precision, and this approach will suffice.

* We will assume the data is normal (fits a bell-curve) and won't change over time. These assumptions are not likely to hold true, however this approach should provide a good approximation. Given these assumptions and using a standard deviation on each side of the average will result in a 68% confidence level.


With a forecast in place it is a simple to evaluate what scope might be completed by a given time. In the example here, the team should be able to complete between 219 and 325 story points by the close of sprint 13.
Evaluate for fixed time, variable scope


Perhaps more common is the desire is to know when a given amount of work will be done. This can take the form of an MVP (minimum viable product) as is demonstrated here. To show this, plot the magnitude of the MVP over time. Note this value may change as the business responds to market need and capability of the team.

In this example, the MVP at 225 story points is likely to be achieved between sprints 10 and 14.


It is important to update the data on a regular basis, iteration boundaries being the most common time. In the example here, sprint 6 has moved to historical and 'today' is identified as sprint 7. Values have been updated, including the average and standard deviation for the last 3 sprints (sprints 4, 5, 6).

You may notice that the cone width has been reduced.  Greater predictability in the time is reflected in the smaller standard deviation, being reduced from 7.55 to 4.51.  This may stem from the team hitting its stride, increasing predictability and improving forecast variability.

Notice that the average velocity has gone up as well, from 22 to 25, and is seen as a slight 'tip up' of the cone. This coupled with increased predictability indicates achievement of the MVP as likely between the sprints 10 and 11.

The evolution of the forecast from sprint 6 to 7 can be seen in the short video below.

Thursday, June 26, 2014

Hitting the Wall

Dec 4, 2016 - This article is moving - please see the article on my personal website listed here - https://robfrohman.com/hitting-the-wall/

-----------------------------

Abstract
All-at-once Scrum implementations require total commitment to change, high level management support and aggressive removal of impediments. Several company-wide implementations are known to the authors but none of them had to deal with the complexity of a large, mission-critical, enterprise software product. Pegasystems develops software to manage, automate and optimize a broad array of business processes.In July of 2009 the company deployed over 20 Scrum teams in the U.S. and India within two months.
Complexity of languages, frameworks, and tools led to an architecture where continuous integration support for software development teams was impossible without a major upgrade in infrastructure and operations. A virtual Scrum team was formed to avoid “hitting the wall” before this impediment impacted the first Scrum release of the software. Here we describe how a Scrum team engineered a continuous integration environment for hundreds of software developers on two continents within a few weeks. 

Sunday, May 4, 2014

Agile Measurement


Measurement is central to agile development and is a natural outcome of the iterative and empirical methods that make up agile practices.  But in any framework, we need ways to measure progress in technology development projects.  So we respond and develop a system of measurement expecting that by being better informed we make better decisions.  However, despite our best intentions we often fall short and end up measuring the wrong things, or worse, we find ourselves dealing with the unintended consequences of misinterpreting the results of poor measurement.


Successful measurement helps us make better decisions and drive desired behaviors.  So it is important to understand why, what, and how we measure.  At the same time, it is equally important that we consider the impact of performing measurement on teams and individuals.


Why We Measure

Measurement is a natural activity.  We like to measure in sports, to evaluate the relative strength of teams or players to predict an outcome.  In manufacturing we use measurement to evaluate variation from specification or adherence to process.  We evaluate network capacity in IT to help plan for network expansion.  In business, we might use metrics to help evaluate the effectiveness of a marketing campaign or whether or not to acquire a company.  In most cases, measurement provides us a sense of control, whether that is real or perceived.

A Variant of the Stacey Matrix
Developing software is obscure work by its nature, so it is difficult to measure progress.  Yet we treat it like an assembly line, with management directing the movement of value from the minds of engineers to the customer.  Development might seem like manufacturing widgets or building houses, but in truth it is quite different.  This creative process is inventive, rather than constructive, and measurement brings to it clarity and insight.

Compounding this complexity are the poorly defined requirements and shifting technology that typically accompany technology projects.  To manage this work, empirical methods are usually more effective than directed methods.  Implemented well, these methods provide greater capability when adapting to changing conditions.  Though to be effective, empirical methods require sound evidence for decision-making, so they rely heavily on good measurement.

Measure to gain understanding of the development process, and to make informed and data-driven decisions when adapting to changing requirements, technology, and market conditions. 


What We Measure

We intend to measure the ‘right things’ but often we end up measuring the ‘easy things’.  Of course, the issue is if the ‘easy things’ are not the ‘right things’, poor decisions will follow due to their basis on ineffective or misleading data.

Not often used today, lines-of-code (LOC) provides a good example of something trivial to measure but with ambiguous meaning.  At first glance LOC seems to make sense.  We pay programmers to write code so the more lines-of-code they write the more productive they are, right?  Well, not exactly.  LOC is a measure of magnitude and we have not established that more = better.  This becomes apparent if we shift our thinking to outcomes.  For example, few would argue that a given piece of software was ready to ship to a customer because engineering had written some arbitrary number of lines of code, much in the same way a book should not be considered ready for publication because the author had written a certain number of pages.

Perhaps shippable product was not what we intended by this measurement after all.  Maybe we were interested in evaluating how busy the engineers were.  Unfortunately, the metric fails here too.  In practice good programmers may improve code by reducing line-count as they refactor code that has become inefficient through organic growth.  In this case, it would be a mistake to conclude a team was not productive if the line-count failed to increase.

Developing metrics with focus on outcomes helps avoid such pitfalls by clearly establishing the intent and expected interpretation of the measurement.  Examples of outcome-focused measurement might include the value delivered to a customer and the flow of work through a team.  To measure value delivered, teams develop estimates for each increment of work.  As work is completed, teams aggregate the estimates to demonstrate to the business the value delivered by that team.  To measure flow, teams might measure the amount of time between the creation of a requirement and the delivery of that requirement to a production system.  Using this information, teams can identify opportunities for improvement.  Metrics focused on outcomes require more thought but they yield better understanding while at the same time avoid the drawbacks of poor measurement.

Measure with focus on outcomes and understand the intention of the measurement.  These measures may be harder to develop, but they will provide a better context for making decisions.


How We Measure

It is challenging to develop good metrics so take an iterative and incremental approach, letting the metrics evolve over time.  Demonstrate ideas early and solicit feedback, do not wait until a measure or chart is ‘ready’ for the organization.  The response received will be valuable and transparency helps foster a sense of trust, which is important in establishing legitimacy.  In addition, transparency will help engage the organization by establishing, as a natural activity, measurement and the data-driven decision-making that follows it. 


Measures including bug counts and cycle-time help us gain insight into product quality and process efficiency.  However there are other dimensions that we would like to evaluate but they may come with some difficulty.  An example is predictability, or the ability to forecast when a given piece of functionality might be ready for the market.  In principle it is simple.  Evaluate how much work there is and the capacity of a team to do that work and then perform a simple calculation.  The challenge is that both scope of work and team capacity will likely rely on estimation.  


Estimation is an essential skill and teams must gain proficiency to address the inherent ambiguity that is associated with forecasting in technology projects.  It can be challenging, or even intimidating, but with practice teams can quickly demonstrate consistent estimates.  Contributing to the discomfort in estimating is a tendency to pursue precision, rather than accuracy.  Accuracy is the goal, as changing conditions in technology projects make developing precise estimates a pointless exercise.  Further, the time and energy used to develop a precise estimate is usually better spent on developing the product, leaving the variance to average out over time.  

Let’s look at mowing the lawn to demonstrate this point.  Drawing on previous experience with grass length, moisture, and the weather forecast, we might conclude it will take about two hours to mow the lawn.  Previous mows have taken between 110 and 135 minutes to complete, so this is an accurate estimate with a reasonable amount of risk due to variance.  Alternatively, we could develop a precise estimate. We could sample grass length, measure moisture conditions, and review weather forecasts.  Taking these data, we could evaluate them for several test strips of lawn to determine a rate.  Using this rate and a precise measure of the whole lawn, we can calculate the precise estimate.  Assume the result of the calculation is 128.63 minutes; are we better off with the precision?  We must consider what value precision brings as the cost may be significant.  More often than not, accurate estimates will suffice and it is best to just get to work.

Measure transparently and evolve metrics to meet the needs of the organization by engaging stakeholders early for feedback.  For metrics based on estimation, focus on accuracy, not precision, and let teams improve their estimation ability through experimentation.


Humanistic Perspectives

Measurement and incentive can have unintended consequence, as is demonstrated in Scott Adams’ classic Dilbert cartoon from 1995.


The manager’s intent is clear but he fails to understand that writing quality software is difficult and writing terrible software is very, very easy.  The desired behavior is that the engineers will spend their time identifying and fixing bugs that already exist in the software.  Instead, the engineers respond to the incentives by writing new and low-quality software, and reap the rewards that come from it.  

The structure of this measure and the incentives that follow will only perpetuate the creation of low-quality software.  In fact, this scenario is more destructive than it first appears.  If we were to evaluate team performance by measuring bug discovery rate, LOC, and payouts to employees for bugs found, what would we expect to see?  These indicators would likely increase with more bugs being discovered and fixed, and we would conclude the quality of the software is increasing.  However the new and low-quality software has the focus of engineering and the existing bugs will receive little attention.  The net result is the overall quality of the software is likely to go down.

This example assumes an ineffective development culture.  Though in high-performing environments, be careful to establish metrics that do not work against good cultural norms, e.g., pride in software quality.

Acknowledge the impact of measurement on teams and individuals and evaluate this impact to establish incentives that encourage desired behaviors.


Summary

If accused of success, what would be the evidence?

Measurement is a natural activity in agile development, so work to establish it as a part of the culture.  Leverage metrics to help all stakeholders evaluate the best courses of action through transparent and qualified data.  With good data, the organization can improve predictability, efficiency, quality, and even employee happiness.
  • Measure to gain understanding of the development process, and to make informed and data-driven decisions when adapting to changing requirements, technology, and market conditions. 
  • Measure with focus on outcomes and understand the intention of the measurement.  These measures can be harder to develop, but they will provide a better context for making decisions.
  • Measure transparently and evolve metrics to meet the needs of the organization by engaging stakeholders early for feedback.  For metrics based on estimation, focus on accuracy, not precision, and let teams improve their estimation ability through experimentation.
  • Acknowledge the impact of measurement on teams and individuals and evaluate this impact to establish incentives that encourage desired behaviors.